Code Profiler is a profiler plugin to measure the performance of your WordPress plugins and themes on your server, at the PHP level. By bringing the power of code profiling applications such as Xdebug to all WordPress users, it makes it super easy to locate any bottleneck in order to speed up your website.
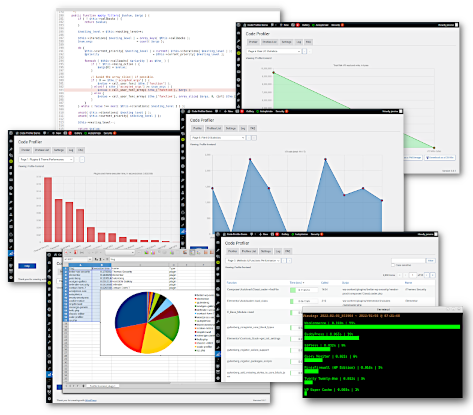
It generates an extremely detailed and easy to read analysis in the form of charts and tables that shows not only which plugin or theme, but also which PHP script, class, method and function is slowing down your website. It displays many useful additional information such as database queries, remote connections, file I/O operations and disk I/O usage as well.
All that without leaving your WordPress admin dashboard: install the plugin, activate it and you can start profiling like a pro right away. Alternatively, you can even run it from a terminal with WP-CLI, the command-line interface for WordPress.
Features
- Plugins & themes performance profiling.
- [Pro] Scripts performance profiling.
- [Pro] Methods & functions performance profiling.
- [Pro] Database queries performance.
- [Pro] Remote connections monitoring.
- [Pro] File I/O operations monitoring.
- File I/O statistics.
- Disk I/O monitoring.
- WP-CLI integration.
- Export charts in PNG image format.
- [Pro] Export all tables and charts in CSV file format.
- [Pro] Filtering options
See it in action:
Downloads
Free version: https://wordpress.org/plugins/code-profiler/
Premium version: https://code-profiler.com/