Following the benchmark tests that we published last year, this article will focus on NinjaFirewall in a production environment, facing two real brute-force attacks.
The victim
It is a small VPS with the following specifications:
- Intel Xeon L5640 @ 2.27GHz
- 1 GB of RAM
- Nginx/1.6.1 + PHP-FPM/5.3.29
- 64-bit Linux kernel 3.2.58-xenU-11-50785a6-x86_64
- munin-node for monitoring
- WordPress 4.0 with NinjaFirewall (WP+ edition) 1.0.6
There is no specific performance optimization, the VPS server is hosting one single WordPress blog having only +/-250 unique visitors a day.
The first attack
The attack came from IP 217.199.161.42, a Plesk server that was apparently compromised. It started on September 11, 2014 at 06:44:36PM (+0200) and stopped 16 minutes and 15 seconds later, at 07:00:51PM. During those 975 seconds, it sent 30,607 HTTP POST requests to the wp-login.php page.
With an average of 31 requests per second, this is quite a large and unusual attack. Most of them will not send more than 10 requests per second because, unlike a DOS attack, their main goal is to find users password, not to take the blog down (if the site became unreachable, the brute-force attack would fail).
A sample of the HTTP server log shows that it even reached up to 36 POST requests per seconds:
217.199.161.42 - - [11/Sep/2014:19:00:39 +0200] "POST /wp-login.php HTTP/1.0" 401 606 "-" "-" "-" "[obscured]"
217.199.161.42 - - [11/Sep/2014:19:00:39 +0200] "POST /wp-login.php HTTP/1.0" 401 606 "-" "-" "-" "[obscured]"
217.199.161.42 - - [11/Sep/2014:19:00:39 +0200] "POST /wp-login.php HTTP/1.0" 401 606 "-" "-" "-" "[obscured]"
217.199.161.42 - - [11/Sep/2014:19:00:39 +0200] "POST /wp-login.php HTTP/1.0" 401 606 "-" "-" "-" "[obscured]"
217.199.161.42 - - [11/Sep/2014:19:00:39 +0200] "POST /wp-login.php HTTP/1.0" 401 606 "-" "-" "-" "[obscured]"
217.199.161.42 - - [11/Sep/2014:19:00:39 +0200] "POST /wp-login.php HTTP/1.0" 401 606 "-" "-" "-" "[obscured]"
217.199.161.42 - - [11/Sep/2014:19:00:39 +0200] "POST /wp-login.php HTTP/1.0" 401 606 "-" "-" "-" "[obscured]"
217.199.161.42 - - [11/Sep/2014:19:00:39 +0200] "POST /wp-login.php HTTP/1.0" 401 606 "-" "-" "-" "[obscured]"
217.199.161.42 - - [11/Sep/2014:19:00:39 +0200] "POST /wp-login.php HTTP/1.0" 401 606 "-" "-" "-" "[obscured]"
217.199.161.42 - - [11/Sep/2014:19:00:39 +0200] "POST /wp-login.php HTTP/1.0" 401 606 "-" "-" "-" "[obscured]"
217.199.161.42 - - [11/Sep/2014:19:00:39 +0200] "POST /wp-login.php HTTP/1.0" 401 606 "-" "-" "-" "[obscured]"
217.199.161.42 - - [11/Sep/2014:19:00:39 +0200] "POST /wp-login.php HTTP/1.0" 401 606 "-" "-" "-" "[obscured]"
217.199.161.42 - - [11/Sep/2014:19:00:39 +0200] "POST /wp-login.php HTTP/1.0" 401 606 "-" "-" "-" "[obscured]"
217.199.161.42 - - [11/Sep/2014:19:00:39 +0200] "POST /wp-login.php HTTP/1.0" 401 606 "-" "-" "-" "[obscured]"
217.199.161.42 - - [11/Sep/2014:19:00:39 +0200] "POST /wp-login.php HTTP/1.0" 401 606 "-" "-" "-" "[obscured]"
217.199.161.42 - - [11/Sep/2014:19:00:39 +0200] "POST /wp-login.php HTTP/1.0" 401 606 "-" "-" "-" "[obscured]"
217.199.161.42 - - [11/Sep/2014:19:00:39 +0200] "POST /wp-login.php HTTP/1.0" 401 606 "-" "-" "-" "[obscured]"
217.199.161.42 - - [11/Sep/2014:19:00:39 +0200] "POST /wp-login.php HTTP/1.0" 401 606 "-" "-" "-" "[obscured]"
217.199.161.42 - - [11/Sep/2014:19:00:39 +0200] "POST /wp-login.php HTTP/1.0" 401 606 "-" "-" "-" "[obscured]"
217.199.161.42 - - [11/Sep/2014:19:00:39 +0200] "POST /wp-login.php HTTP/1.0" 401 606 "-" "-" "-" "[obscured]"
217.199.161.42 - - [11/Sep/2014:19:00:39 +0200] "POST /wp-login.php HTTP/1.0" 401 606 "-" "-" "-" "[obscured]"
217.199.161.42 - - [11/Sep/2014:19:00:39 +0200] "POST /wp-login.php HTTP/1.0" 401 606 "-" "-" "-" "[obscured]"
217.199.161.42 - - [11/Sep/2014:19:00:39 +0200] "POST /wp-login.php HTTP/1.0" 401 606 "-" "-" "-" "[obscured]"
217.199.161.42 - - [11/Sep/2014:19:00:39 +0200] "POST /wp-login.php HTTP/1.0" 401 606 "-" "-" "-" "[obscured]"
217.199.161.42 - - [11/Sep/2014:19:00:39 +0200] "POST /wp-login.php HTTP/1.0" 401 606 "-" "-" "-" "[obscured]"
217.199.161.42 - - [11/Sep/2014:19:00:39 +0200] "POST /wp-login.php HTTP/1.0" 401 606 "-" "-" "-" "[obscured]"
217.199.161.42 - - [11/Sep/2014:19:00:39 +0200] "POST /wp-login.php HTTP/1.0" 401 606 "-" "-" "-" "[obscured]"
217.199.161.42 - - [11/Sep/2014:19:00:39 +0200] "POST /wp-login.php HTTP/1.0" 401 606 "-" "-" "-" "[obscured]"
217.199.161.42 - - [11/Sep/2014:19:00:39 +0200] "POST /wp-login.php HTTP/1.0" 401 606 "-" "-" "-" "[obscured]"
217.199.161.42 - - [11/Sep/2014:19:00:39 +0200] "POST /wp-login.php HTTP/1.0" 401 606 "-" "-" "-" "[obscured]"
217.199.161.42 - - [11/Sep/2014:19:00:39 +0200] "POST /wp-login.php HTTP/1.0" 401 606 "-" "-" "-" "[obscured]"
217.199.161.42 - - [11/Sep/2014:19:00:39 +0200] "POST /wp-login.php HTTP/1.0" 401 606 "-" "-" "-" "[obscured]"
217.199.161.42 - - [11/Sep/2014:19:00:39 +0200] "POST /wp-login.php HTTP/1.0" 401 606 "-" "-" "-" "[obscured]"
217.199.161.42 - - [11/Sep/2014:19:00:39 +0200] "POST /wp-login.php HTTP/1.0" 401 606 "-" "-" "-" "[obscured]"
217.199.161.42 - - [11/Sep/2014:19:00:39 +0200] "POST /wp-login.php HTTP/1.0" 401 606 "-" "-" "-" "[obscured]"
217.199.161.42 - - [11/Sep/2014:19:00:39 +0200] "POST /wp-login.php HTTP/1.0" 401 606 "-" "-" "-" "[obscured]"
The full HTTP access log can be downloaded here: server_access.log.tgz (15Kb)
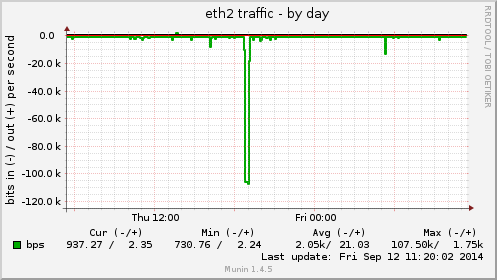
On the first munin-node graph, we can see the 16-minute incoming attack, reaching 107 kbit/s on the eth2 interface:
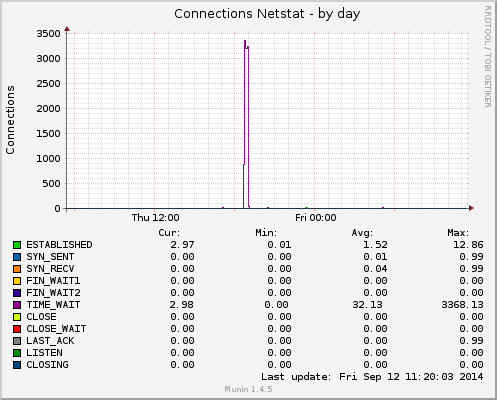
The second graph shows the number of connections and their respective state at the kernel firewall level. During the attack, there were 3k+ connections in the TIME_WAIT state:
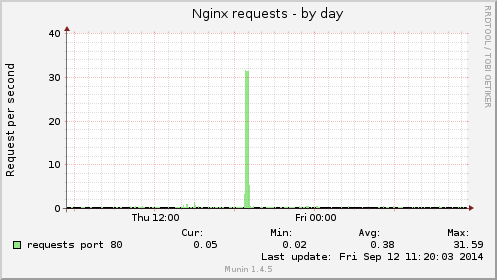
The HTTP server, Nginx, had to deal with an average of 31 requests per seconds:
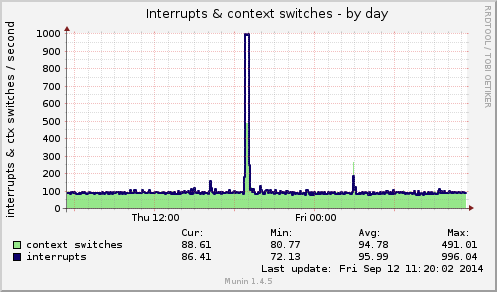
Munin’s interrupts & context switches graph during the attack:
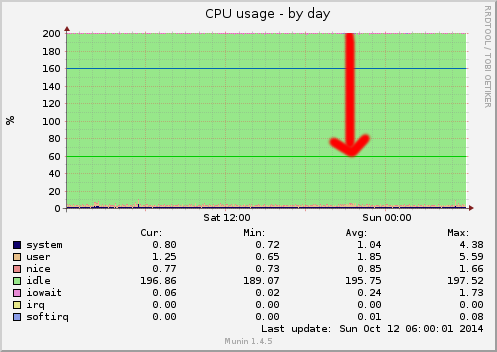
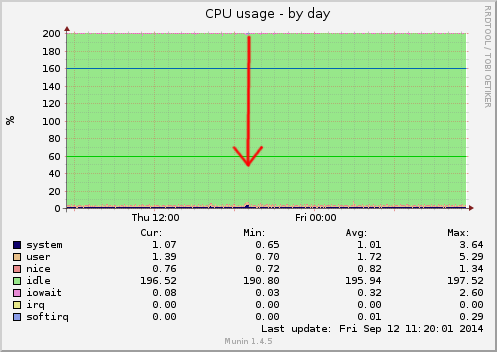
Now, we can have a look at how NinjaFirewall dealt with the attack: the CPU usage graph shows that it barely reached 5% (out of 200%):
The second attack
This attack came from Romanian IP 89.45.249.30. It started on October 11, 2014 at 08:40:44PM (+0200) and stopped 1 hour, 2 minutes and 43 seconds later, at 09:43:27PM. During those 3,763 seconds, it sent 27,139 HTTP POST requests to the wp-login.php page.
With an average of 7 requests per second, this is typical attack.
A sample of the HTTP server log shows that it reached up to 10 POST requests per seconds:
89.45.249.30 - - [11/Oct/2014:21:43:24 +0200] "POST /wp-login.php HTTP/1.0" 401 610 "-" "-" "-" "obscured"
89.45.249.30 - - [11/Oct/2014:21:43:24 +0200] "POST /wp-login.php HTTP/1.0" 401 610 "-" "-" "-" "obscured"
89.45.249.30 - - [11/Oct/2014:21:43:24 +0200] "POST /wp-login.php HTTP/1.0" 401 610 "-" "-" "-" "obscured"
89.45.249.30 - - [11/Oct/2014:21:43:24 +0200] "POST /wp-login.php HTTP/1.0" 401 610 "-" "-" "-" "obscured"
89.45.249.30 - - [11/Oct/2014:21:43:24 +0200] "POST /wp-login.php HTTP/1.0" 401 610 "-" "-" "-" "obscured"
89.45.249.30 - - [11/Oct/2014:21:43:24 +0200] "POST /wp-login.php HTTP/1.0" 401 610 "-" "-" "-" "obscured"
89.45.249.30 - - [11/Oct/2014:21:43:24 +0200] "POST /wp-login.php HTTP/1.0" 401 610 "-" "-" "-" "obscured"
89.45.249.30 - - [11/Oct/2014:21:43:24 +0200] "POST /wp-login.php HTTP/1.0" 401 610 "-" "-" "-" "obscured"
89.45.249.30 - - [11/Oct/2014:21:43:24 +0200] "POST /wp-login.php HTTP/1.0" 401 610 "-" "-" "-" "obscured"
89.45.249.30 - - [11/Oct/2014:21:43:24 +0200] "POST /wp-login.php HTTP/1.0" 401 610 "-" "-" "-" "obscured"
The full HTTP access log can be downloaded here: server_access.log2.tgz (22Kb)
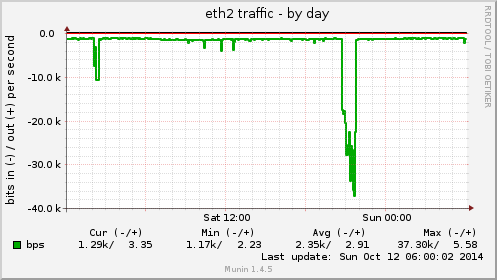
On the first munin-node graph, we can see the 62-minute incoming attack, reaching 37 kbit/s on the eth2 interface:
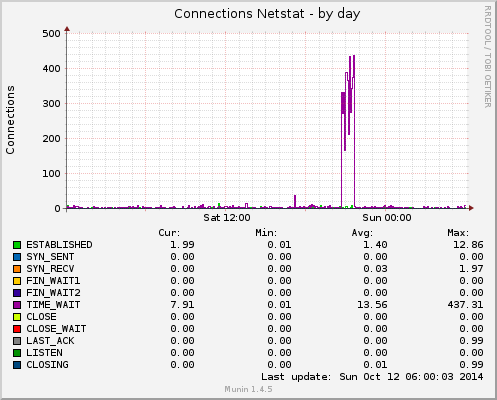
The second graph shows that there were +/-400 connections in the TIME_WAIT state:
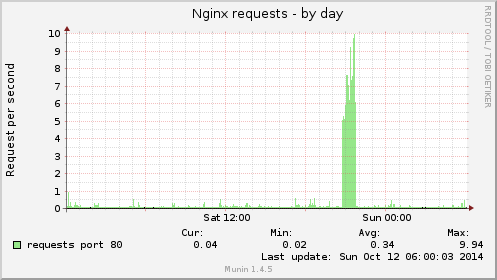
Nginx had to deal with an average of 7 requests per seconds (max. 10 RPS):
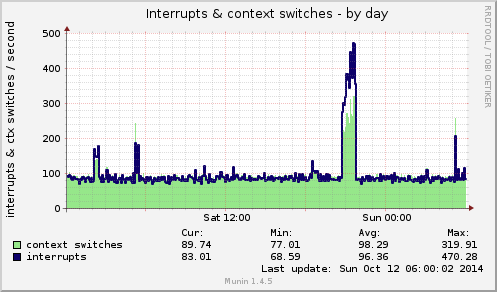
Munin’s interrupts & context switches graph during the attack:
NinjaFirewall performed pretty well, the CPU usage is almost unnoticeable:
